Metrics
Through the metrics page, you can follow the usage of Team O'clock services for your teams.
The Metrics page is accessible from:
Your organization dashboard
The Team management page of one of your teams
A retrospective or standup view from your Timeline
The metrics page has filters and data cards with usage summaries. The data displayed in the cards respect the filter selections.
ℹ️ Metrics page and data are available on Standard and custom plans only.
Filtering options
The available filters are for choosing a period and a team to see metrics for.
The default team option will include information for all the teams a member belongs to or has access to.
The period options have some quick selections for the latest months. You can also choose to see a specific period using a calendar.
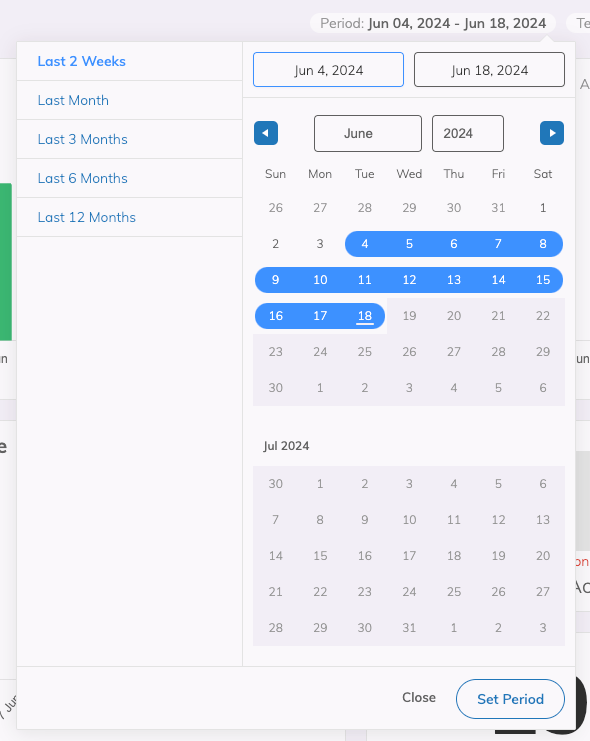
ℹ️ Using the date picker, you can see metrics in Team O'clock for any year your teams are active in the service.
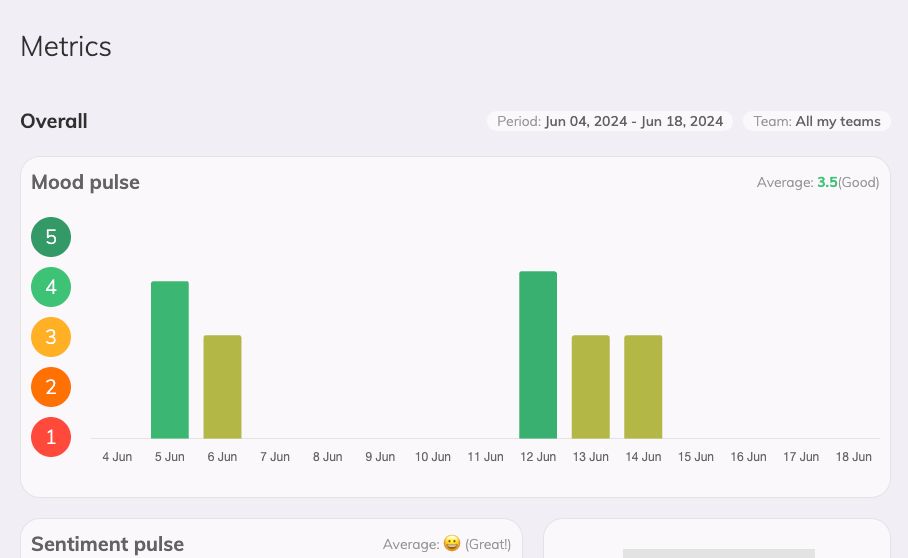
Mood pulse
The Mood pulse card shows how team members feel about work for the selected period.
This card consists of a graph with the aggregated average mood votes for the selected team in the defined period. Mood information derives from a mood question asked to all participants of a standup or retrospective meetings, read more.
The aggregated average value for the selected period is displayed on the top right of the Mood pulse card.
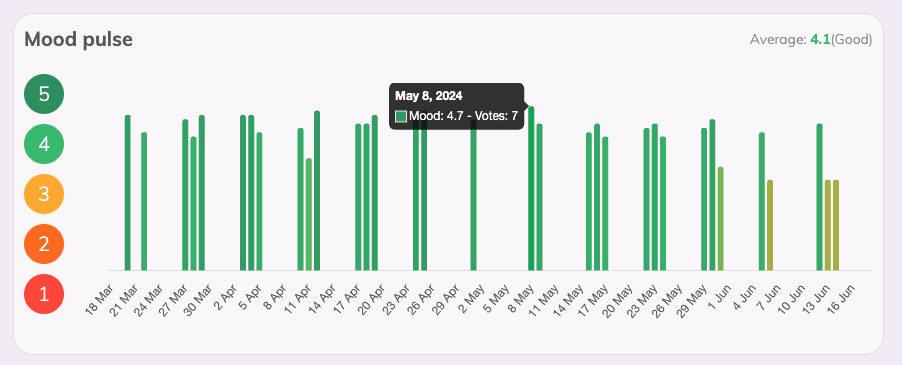
Hovering with your mouse over an option you can see the average mood value for the specified date.
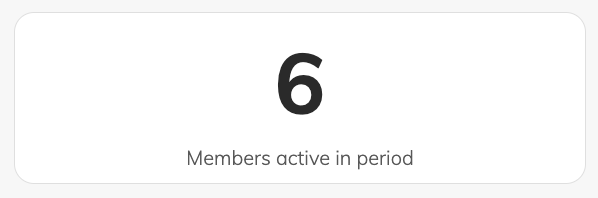
Members activity
This card shows the number of members that engaged with a meeting activity in Team O'clock for the selected period.
Resolved vs Open action items
In this card, you will find information regarding the ratio between resolved and open action items. The information on display is about action items created in the selected period.
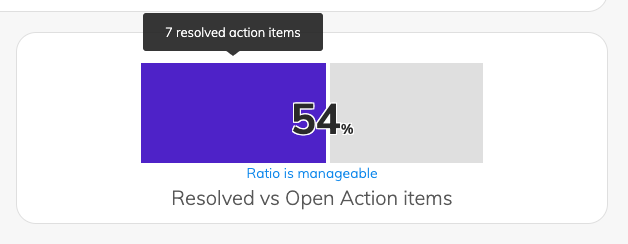
Hovering on one of the two displayed areas you get the exact number of action items for the specific category, resolved or open.
Having this ratio available for your team you can evaluate how your team is progressing towards the goals you have set in your retrospective meetings.
Agility metrics
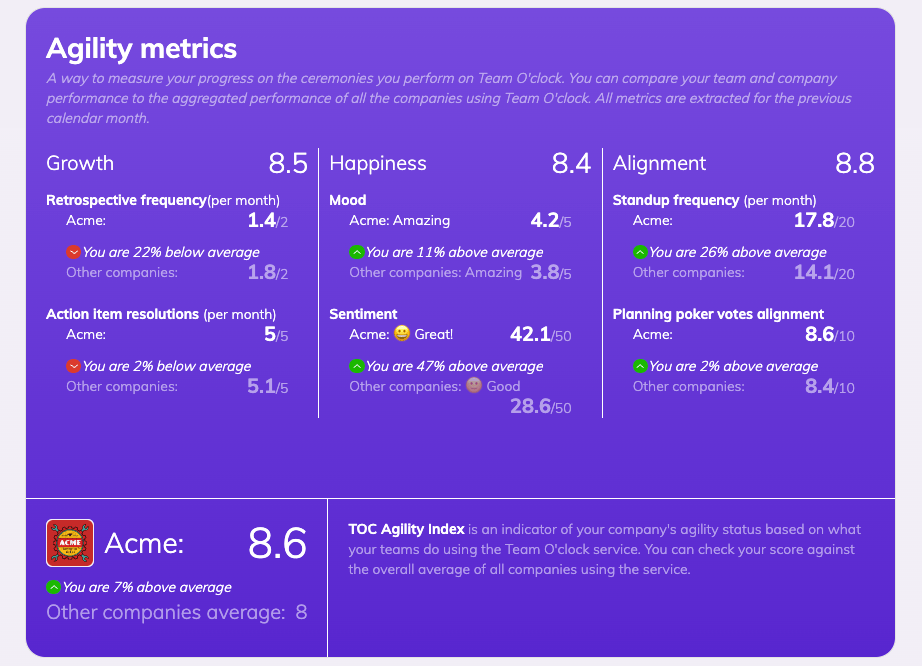
In this card, you will see a summary of how your company teams performed scrum meetings compared to the aggregated averages of all company teams using Team O'clock. With aggregated data from the last complete month, you can check your teams' performance over three categories:
Growth, generated by retrospective metrics for frequency of sessions and resolved action items.
Happiness is generated by the measured team Mood and team sentiment.
Alignment generated by standup frequency and vote alignment of planning poker tasks.
The above metrics are averaged to produce the overall company agility number.
For each of the displayed numbers, you see a comparison with the overall average, marked with either an up or down arrow. Read more about Agility metrics.