
Is Agile Dead? Insights from 2024 Team O’clock Data
Is Agile dead?
Are teams looking for agility?
What's the team's resistance to change?
If not Agile then what?
Instead of adding one more article on the debate, we look into the data from 2024 Team O'clock usage and build some insights. We'll briefly introduce you to the data sources used as a reference before jumping to the insights. You can explore the actual data at the bottom of this post.
If you don't have the time to dive in here's the TL;DR version:
Teams are entering a maturing phase of their agility practices where they deliberately choose what to keep and what to drop.
There's some "Agile tiredness" but not fatigue.
Team alignment goes up which signals the need for efficiency
Weekly cadence sets the pace of continuous iterations
There's a focus on the estimation and predictability aspects of agility, estimation sessions are still at the top.
There are some issues with Time Management, specifically on the Daily Standup
The Data Sources
This year we get data from more areas of Team O'clock, thus having a more complete idea of the status. Specifically, we will be looking into:
Meeting data, including meetings' durations, participations, action items, sync vs. async meetings, vote alignment etc.
Agility Index, holding an accumulation of agile behavior across all teams using Team O'clock. Specifically looking into team Growth, Happiness, and Alignment as described in Agility Metrics.
Team Behaviors measuring team intentions through usage of the Agility cards. Agility Cards are automatically issued when a meeting ends and reflect the team's behavior.
Data are fully anonymized and taken as a sum, to reflect overall behaviors and trends across all teams on Team O'clock. To check the full measurements, check at the bottom of this post.
Insights around Continuous iterations
1. Entering a mature phase of teams agility
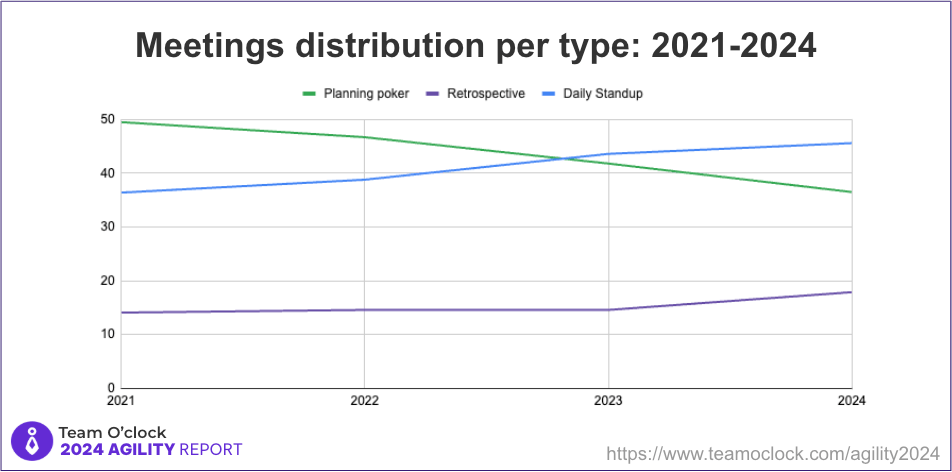
Based on Team Meeting metrics on meetings distribution, there are more Daily Standup meetings than estimation sessions. We also see Retrospective meetings being more adopted. Both are indicators of bigger agile maturity, where teams understand the fundamentals of what these meetings have to offer.
Checking the distribution of the Agility Cards per meeting type we see a similar story, Planning Poker related cards leading with almost 50% of the total cards issued, followed by Daily Standup related cards with 33.4% and finally Retrospective related cards with a 16.6%. According to the Study on Agility Posture, the current state is where teams start to "get" what agile is about (small "a" on purpose as we're talking about the essence of agility).

This insight alone is a sign that agile is becoming "business as usual" for the teams practicing it.
2. Not "Agile Fatigue", but "Agile tiredness"
Checking the data around Agility Index we see that it is steadily declining since 2022 (first measurement) with Growth metrics being the ones mostly affected. As team growth is a big pillar of the "Agile" movement, a decline there implies that the teams are working less towards their growth and improvement.
Following up to the above with data from Agility Cards, we see that teams intend to work on their growth by performing Retrospectives and generating action items, but fail to follow-up to those action items by resolving them. Taking into account that we're talking about one app data - Team O'clock - we need to factor in the case of false negatives, where people forgot and didn't care updating the action item status in the service.
3. Team Alignment goes up, means that teams care for efficiency
Agility data around alignment display an increase in alignment efforts from teams. The respecting index has grown to 87.8% in 2024, up from 86% in 2023.
The same story is shared from behavioral data. Firstly, most of the Agility Cards issued relate to alignment meetings (Estimation through Planning Poker, and Daily Standup). Following the above, we see that participation and habit-building behaviors are important for teams. Combining the two observations, we can say that teams want to align and build habits around that alignment.
Thus we reach the point mentioned in the title: Better team alignment, means team efficiency. By achieving better alignment, teams can work more efficiently as less communications are needed to reach an agreement.
4. Weekly cadence sets the "continuous" part in agility
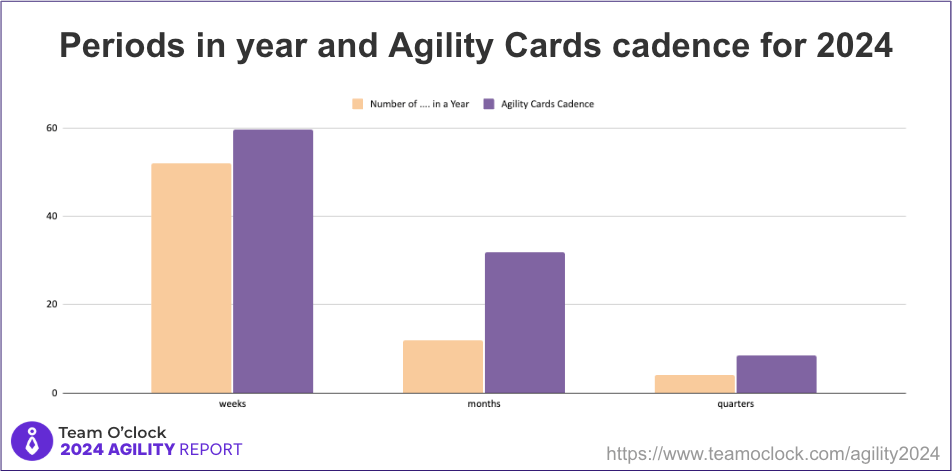
Agility Cards cadence breakdown data tells a story of how often teams perform a good meeting. Checking this data for 2024 we clearly see that weekly events are the ones driving team behaviors. Specifically, Agility cards related to the Planning Poker session and the Daily Standup.
This behavior makes total sense, as both meetings - Planning Poker for estimation, and Daily Standup for team alignment - focus on tasks that the team is working right now or will be working in the near future. That's the "here and now" of team work which is more practical and relatable to start with.
After teams build a weekly cadence with the agility, they have produced enough "material" and topics worthy for a longer term evaluation - through a Retrospective meeting and generating team growth action items.
The distribution of Agility Cards cadence breakdown, shows a "healthy" distribution partially matching to the number of weeks, months, and quarters in a year.
In 2024 we noticed a significant drop in "Daily Standups" performed daily, gone from a 15 days in a month to 6.6 days in a month. Although this observation contradicts the weekly cadence on the surface, it is a sign of team maturity. Teams observe and adjust their meetings schedule to fit their needs. In this case, Daily Standups are not performed daily but a team always have one or two Standups within a week.
5. Focus on the "Estimations and Predictability" parts of agility
Team Meeting metrics for Planning poker tell a story of great agility. In 2024, teams have managed to improve their alignment over estimating work effort. Overall vote alignment has jumped to 86% from a 50% in 2023. High alignment in votes in a team means agreement around the effort needed. Additionally, the average voted effort for a task has dropped to 3.5 in the Fibonacci scale. This means that teams are mature enough to properly breakdown a large piece of work into tasks of low effort.
With a bit more digging on the Agility Cards cadence we clearly see that weekly estimation sessions with Planning Poker contribute the most in the continuous weekly cadence discussed above. That's an indicator of teams trying to improve their predictability of work to be done.
If you're at this stage and considering the next step, read What to do next if you already working with Planning Poker.
If you believe you should stop with Planning Poker, checkout Is Planning Poker a waste of time?
6. Teams are facing issues with time management on Daily Standup
Daily Standup is a timeboxed meeting where all team members share updates on stuff that each one works on, seeking for assistance if needed so that they are unblocked. Ensuring that the Daily Standup meeting is timeboxed makes team engagement easier. On the other side, a long Daily Standup meeting makes team members disengaged - not listening what their colleagues share.
Checking the Meeting times for the sync Daily Standup, we see that although the average duration of the meeting is 9 minutes, the respecting average time each member talks is around 8 minutes. This means that in the majority of the meetings the 15 minute timebox of Daily Standup is not followed.
Based on Agility cards issued for proper timeboxing of Daily Standups we see that only 1 in 4 teams safeguards the Daily Standup meeting duration. This means that 3 out of 4 teams consider that Daily Standup is just another meeting added in their calendars, blocking them from work.
Final thoughts
So, is Agile dead? I'd very much like to follow up with a separate article but, for now, data from teams on Team O'clock tells us: "We don't care using a specific framework or not, we just want to move fast and adapt man"!
Of course there's a strong bias - since we're talking about teams using a tool for agile meetings. Still, that use is not "Agile by the book" or following best practices; the take is more pragmatic and fit to the actual needs.
One more thing to share is that teams and companies on Team O'clock are NOT only pure software companies but come from different industries spanning from Healthcare and Finance, to Media and Consulting. Meaning, when we're talking about agile we're talking about a mindset and principles that can apply across different industries.
The Measurements
Team Meeting data
We gathered all the anonymized data from meeting sessions in Team O'clock to generate the respecting Agility Report page for 2024. Here are some highlights:
Meetings distribution is Retrospectives 17.9%, Daily Standup 45.6%, and Planning Poker 36.5%. This is the second year that we see Daily Standups surpass Planning Poker sessions. This year the difference is reaching a 9% (vs. ~2% in 2023). Additionally, Retrospective meetings now have a significant part of the pie - almost half to Planning Poker sessions.
Retrospective meeting cadence has fallen to an average 0.7 sessions per month. This means that some teams either don't perform a retrospective at all, or they perform a retrospective less often than a month (e.g. once every two months).
On each Retrospective meeting teams create an average of 1.4 new action items, and resolve an average of 1.3 action items. That's a 50% drop since 2023, yet creation AND resolution pace stays the same.
Gathering notes in a Retrospective is the most important stage. In Retrospectives held synchronously - where all members add notes simultaneously - the Sync Gather notes steps lasts 73 minutes on average, in async Retrospectives - where each member adds notes at their own time - the Async Gather note step lasts for 43 hours. In both cases, that's an increase of 7% for sync and 10% for async since 2023.
Teams are performing an average of 6.6 Daily Standups in a month, that's 1.5 sessions a week. This is a significant change since last year. That's an indicator of adaptability and agility that the teams are showing.
Average synchronous Daily Standup duration is 9 minutes, that fits well with the purpose of this meeting - short and precise, no more than 15 minutes. Yet, the average speak time per member is 8 minutes meaning that specific people talk alot while others have little or nothing to share.
The percentages of synchronous and asynchronous Daily Standups are slightly tilting towards synchronous roundup, with 51% being synchronous and 49% being asynchronous Daily Standups. An asynchronous Daily Standup is one where each member shares their notes at their own time.
Diving deeper, 52.4% of asynchronous Daily Standups are held in a chat app while 47.6 are performed in the Team O'clock web interface. That percentage has seen a 5% change in favor of Team O'clock web interface since last year.
Entering estimation sessions, there's a tremendous change regarding effort vote alignment that reached a 86%. This is a jump of 36% since 2023.
Finally for estimation sessions, we see a reduction in the average voted effort per task of 3.5, which is big drop from the 6.7 average voted effort per task in 2023.
Team agility data
Agility has to do with team's intention to grow, stay happy and aligned. The combination of these three factors generates an Agility Index. To get a number for each of the three factors we measure teams' behaviors during Retrospective, Daily Standup, and Planning poker sessions in Team O'clock.
For 2024, the agility metrics are as follows:
Agility index of 69.5% up by 3 points since 2023. There's a small trend here around the "Agile is dead" but of course nothing that can be measured in a tool that is mainly used to facilitate agile meetings like Team O'clock.
Growth index of 54.7% down by 8 points since 2023! Growth index is solely set by Retrospectives (frequency and action item resolutions). This means that teams are either having less Retrospectives or resolve less action items, leaving team growth opportunities unmet.
Happiness index of 66% up by 1.5 points since 2023. This index is generated through sentiment analysis on notes added and the Mood Question replies.
Alignment index of 87.8% up by 15 points since 2023. The alignment index is affected by more "functional" measurements around daily standup frequency and vote alignment.
To have a better view for team agility we can examine the Year-over-Year trends since 2021. Please keep in mind that some features around Happiness measurements were not available in 2021 thus the data are partial.
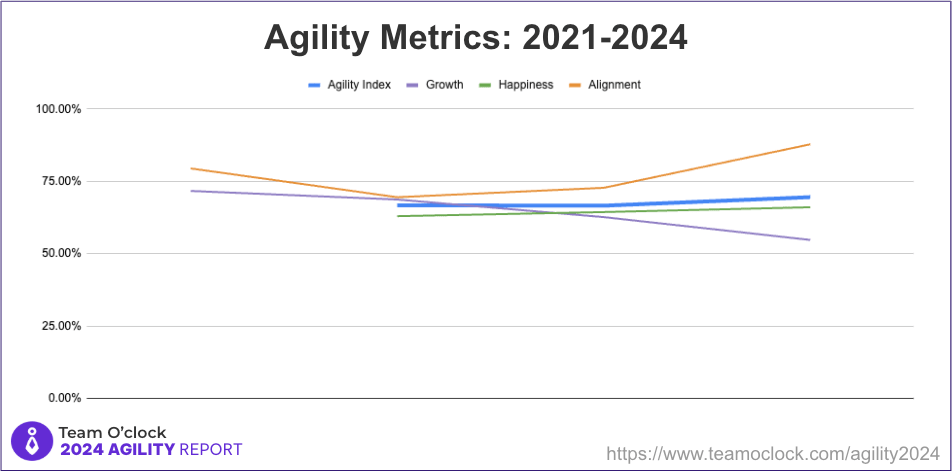
What's clear in the chart above is a decline in the "growth" aspect of the metrics. Another observation relates to the steep drop of the alignment index in 2022 that has started to go up in 2023 and follows that trend in 2024.
Team Behavioral data
To draw behavioral data in a more refined fashion than Team agility we examine the Agility cards that teams acquired in Team O'clock. Agility cards hold more behavioral characteristics that allow for a different grouping of data.
More than 23K Agility Cards were generated in 2024 for teams performing meetings in Team O'clock. The most notable behavioral data are:
Breakdown of Agility Cards per meeting type is: 49.9% from Planning Poker, 33.4% from Daily Standup, and 16.7% from Retrospectives.
Breakdown of Agility Cards per Behavior is: 39.4% around Growth related cards, 30.9% around members meeting participation, 20.9% on habit building behaviors, 4.8% around meeting time management, and 3,9% around resolving action items.
Breakdown of Agility Cards per Cadence - this shows how often teams perform meetings: 59.7% on cards issued for weekly cadence, 31.9% on cards issued for monthly cadence, and 8.4% on cards issued for quarterly cadence.
Planning poker Agility Cards were issued more often for most of the teams on Team O'clock, with the cards "
Task work agreement" and "Estimation presence" being the most popular cards. These cards are issued when teams align over task estimation and members participate in estimation with their votes respectively.
The Retrospective Agility Cards for "Team health" and "Team introspection" were the most popular ones among teams performing Retrospectives. These cards are issued when teams create new action items and hold 2 retrospectives within a period of 1 month.
Standup Agility Cards had lower traction than the rest of the cards with the card for performing at least 2 Standup meetings in a week standing out across teams.
Standup Agility Cards related to time-boxing the Daily standup scored low when compared against all teams that are performing Standups. Only 25% of teams that perform Daily Standups weekly gained a card related to proper time-boxing their meeting to 15 minutes. Out of those teams that successfully timeboxed their Daily Standup in a week, a 81% of teams achieved this for a full month, and a 66.6% of teams achieved consistent Daily Standup timeboxing for a full quarter.


